Note
Go to the end to download the full example code.
Grids and quadrature
Numerical analysis on a spline needs a mesh and a quadrature rule.
pantr.grid provides structured cell grids with implicit connectivity, a lazy BVH
spatial index, and named cell/facet tags; pantr.quad supplies quadrature rules
that cell_quadrature() maps onto a grid’s cells. Together with the
element extraction of Knot operations and Bézier extraction, these are the building
blocks of an isogeometric assembly loop.
This tutorial integrates a function, queries the grid spatially, and renders both a tensor-product and a hierarchical grid.
import numpy as np

from pantr import viz
from pantr.geometry import AABB
from pantr.grid import cell_quadrature, hierarchical_grid, uniform_grid
from pantr.quad import gauss_legendre_quadrature
Integrate a function over a grid
Map a 3-point Gauss-Legendre tensor rule onto every cell, then sum w * f over
all cells and quadrature points. The result matches the analytic integral.
grid = uniform_grid([[0.0, 1.0], [0.0, 1.0]], 16)
rule = gauss_legendre_quadrature(2, 3)
points, weights = cell_quadrature(grid, rule)


def f(xy):
    return np.sin(np.pi * xy[..., 0]) * np.sin(np.pi * xy[..., 1])


integral = float(np.sum(weights * f(points)))
exact = (2.0 / np.pi) ** 2
print(f"∫∫ sin(πx)sin(πy) = {integral:.6f}  (exact {exact:.6f})")
∫∫ sin(πx)sin(πy) = 0.405285 (exact 0.405285)
Spatial query with the BVH
query_aabb returns the cells overlapping a box, backed by a lazily-built
bounding-volume hierarchy. Here we find the cells touching a small window.
9 cells overlap [0.2 0.2]-[0.35 0.35]
Render a tensor-product grid
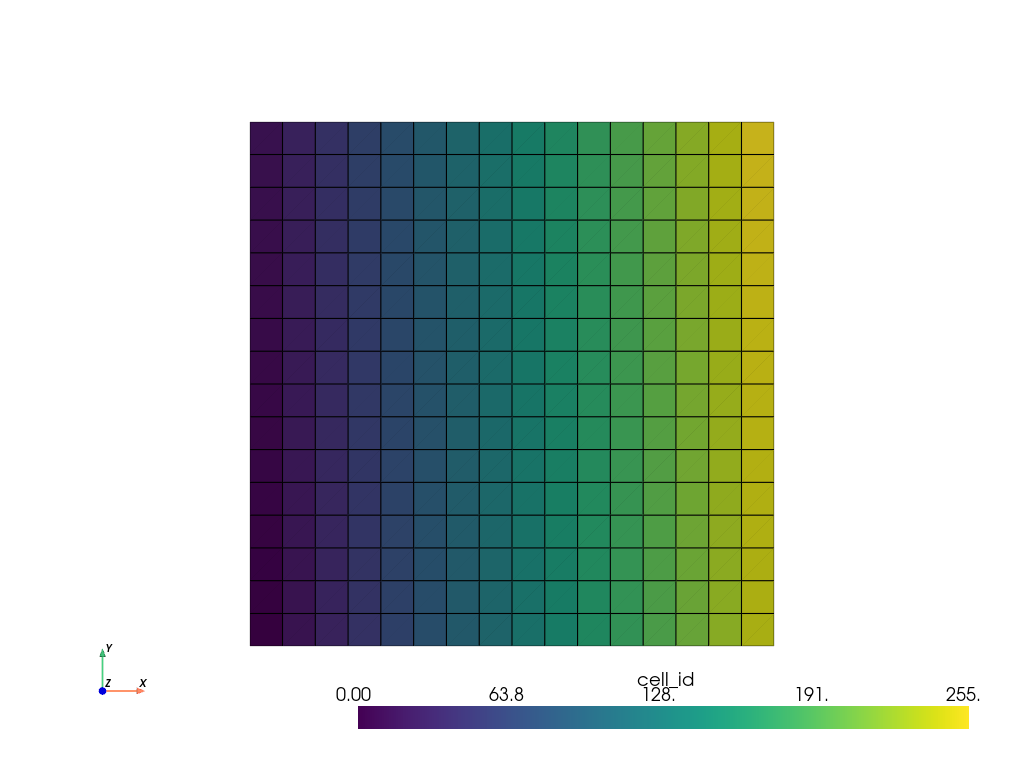
grid_to_pyvista turns any grid into a mesh; we colour cells by their column
index just to show the per-cell data channel.
ug = viz.grid_to_pyvista(grid)
ug.cell_data["cell_id"] = np.arange(grid.num_cells)
ug.plot(scalars="cell_id", show_edges=True, cpos="xy")
A hierarchical grid
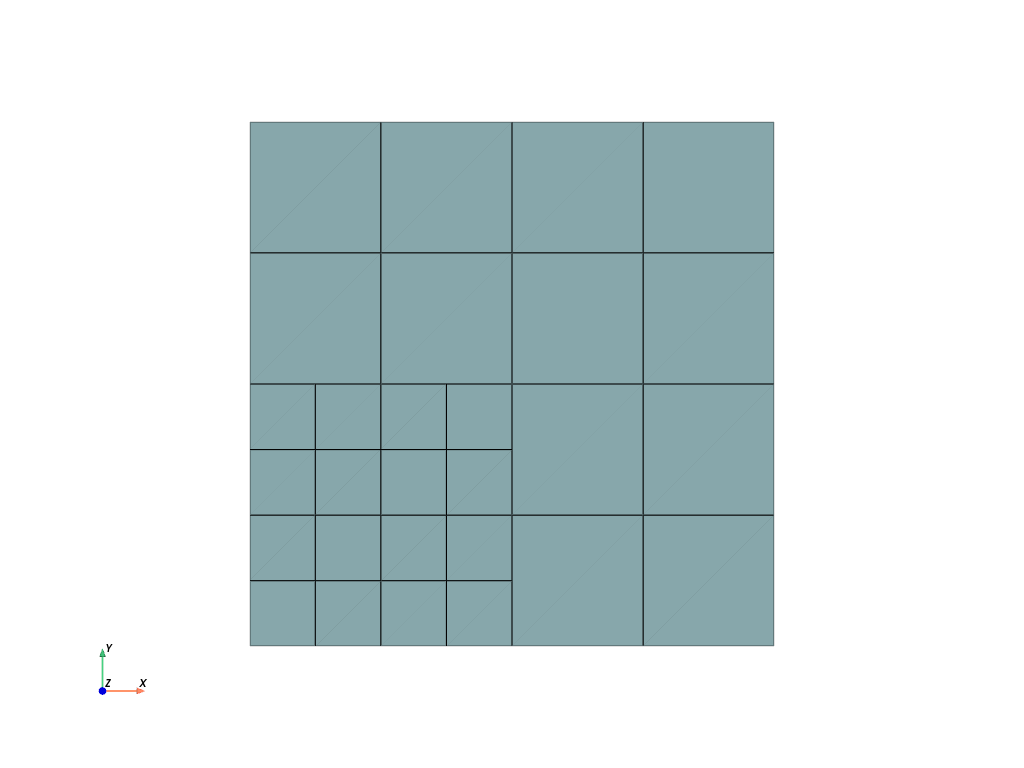
The same export works for a refined hierarchical grid – the active cells show the multi-level structure directly.
hgrid = hierarchical_grid(uniform_grid([[0.0, 1.0], [0.0, 1.0]], 4), 2)
hgrid.refine(0, [0, 0], [2, 2])
viz.grid_to_pyvista(hgrid).plot(show_edges=True, cpos="xy")
Total running time of the script: (0 minutes 0.624 seconds)